Using React-ChartJS-2 with Ionic
This articles explains how TopVault uses React-ChartJS-2 to show collection trends over time. While TopVault aims to minimize the investing and pricing aspects of collecting, knowing values and trends over time will always be important.
This articles explains how TopVault uses React-ChartJS-2 to show collection trends over time.
While TopVault aims to minimize the investing and pricing aspects of collecting, knowing values and trends over time will always be important. As a collector growing your collection, the market value of your goals can be a driver for prioritization. And Value is an extremely helpful tool when performing trades. Thus TopVault includes charts that show daily, weekly, and monthly trends.
These can be found for your the goals you set, your overall collection, and for the daily whole-market trends example for Pokemon Cards.
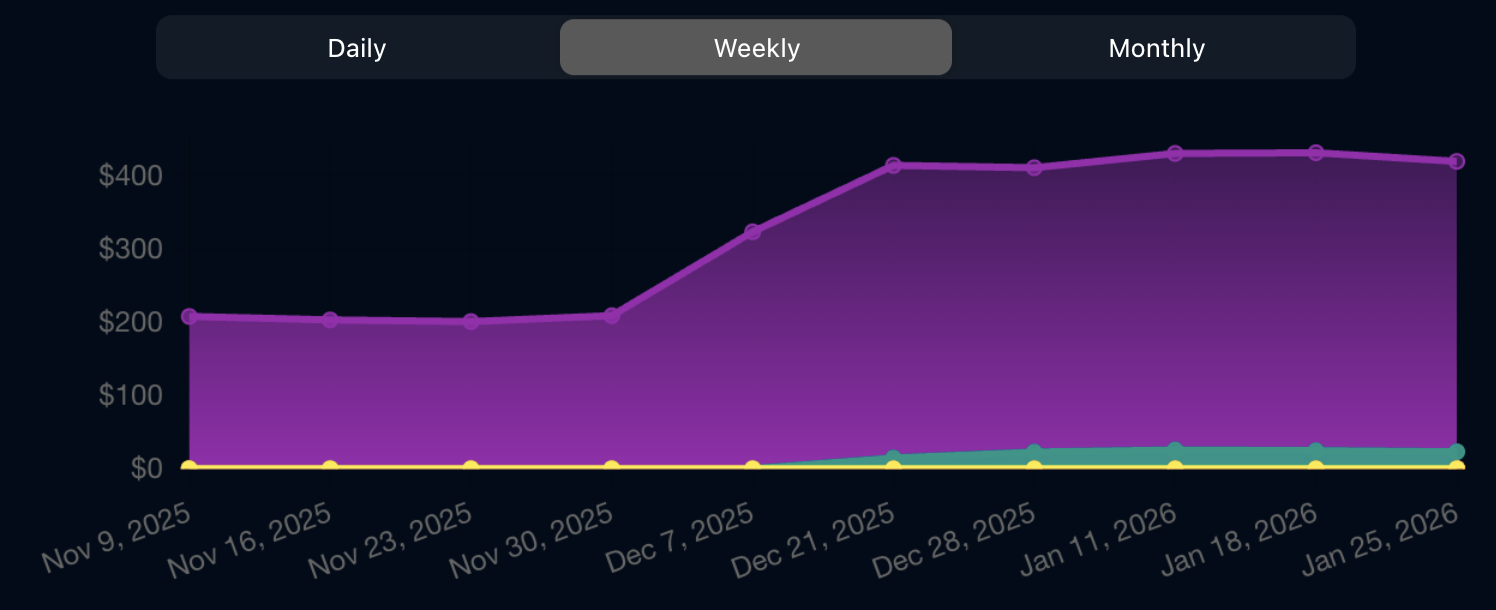
The goals charts are the most interactive. The page will show and hide trends lines based on showing and hiding the associated tabular view. Here's an example showing each goal's trend week over week.
Getting started with dependencies
This is rather straightforward:
sh
npm install chart.js react-chartjs-2 npm install [email protected] [email protected]And the resulting relevent result within the package.json for the Ionic project:
json
{
  "dependencies": {
    "@ionic/react": "8.7.6",
    "chart.js": "4.5.0",
    "react": "19.2.0",
    "react-chartjs-2": "5.3.0",
    "react-dom": "19.2.0"
  }
}
Resulable Chart component
In the TopVault web, and mobile, app there are multiple charts. These all use a base TrendChart component in a TrendChart.tsx file as described below. Starting with the relevant imports:
jsx
import {
  CategoryScale,
  Chart as ChartJS,
  Filler,
  Legend,
  LinearScale,
  LineElement,
  PointElement,
  Title,
  Tooltip
} from 'chart.js';
import { Line } from 'react-chartjs-2';
ChartJS.register( CategoryScale, LinearScale, PointElement, LineElement, Filler, Title, Tooltip, Legend );
The component is then rather straightforward. In this example the component allows the caller to set selected datasets, called TrendDataset, as shown or hidden. A dataset is both the data-points with their number being a price point on the Y axis, and a group of attributes describing show to show the dataset.
jsx
export interface TrendDataset {
  label?: string;
  data: number[];
  borderColor: string;
  backgroundColor: string | ((context: ScriptableContext<'line'>) => CanvasGradient);
  fill?: boolean;
  pointStyle?: string;
  barThickness?: number;
  borderRadius?: number;
  hoverBackgroundColor?: string;
}
The TrendChart receives the list of datsets and a list of labels for the X axis. As a convenience, the component receives a set of hidden datasets and dynamically removes them based on the label.
jsx
interface TrendChartProps {
  data: {
    abels: string[];
    datasets: TrendDataset[];
  };
  hiddenLabels?: Set<string>;
}

export function TrendChart({ data, hiddenLabels }: TrendChartProps) {
  const filteredData = hiddenDatasets ? {
    ...data,
    datasets: data.datasets.filter( dataset => !hiddenLabels.has(dataset.label ?? '') ),
  } : data;

  return (
    <div className="trend-chart-outer">
      <Line options={TREND_CHART_OPTIONS} data={filteredData} />
    </div>
  );
}
// Minimal CSS for the provied example:
// .trend-chart-outer {
//   height: 200px;
//   width: 100%;
//   position: relative;
// }
Chart options are used to nicely show the value as a price point for a collector's goal, or for market trends, at a given data point. These will be highly specific to the look and feel for how the chart is used. As an example the TrendChart uses:
jsx
export const TREND_CHART_OPTIONS = {
  esponsive: true,
  maintainAspectRatio: false,
  scales: {
    y: {
      beginAtZero: true,
      min: 0,
      ticks: {
        callback: (value: number | string) => {
          return `$${value}`;
        },
      },
    },
  },
  plugins: {
    legend: {
      display: false,
    },
    tooltip: {
      padding: 12,
      boxWidth: 10,
      boxHeight: 10,
      boxPadding: 3,
      usePointStyle: true,
      callbacks: {
        label: (context: TooltipItem<'line'>) => {
          return moneyValue(context.parsed.y);
        },
      },
    },
  },
};
To make the fill under the lines look nicer, and also reflect the color a user has chosen for their goal, a gradient fill can be used:
jsx
// Convert hex color to rgba
export function hexToRgba(hex: string, alpha: number): string {
  let hexValue = hex.replace('#', '');
  if (hexValue.length === 3) {
    hexValue = hexValue .split('').map(x => x + x) .join('');
  }
  const num = parseInt(hexValue, 16);
  const r = (num >> 16) & 255;
  const g = (num >> 8) & 255;
  const b = num & 255;
  return `rgba(${r},${g},${b},${alpha})`;
}
// Create a gradient background for a trend line
export function createTrendGradient(ctx: CanvasRenderingContext2D, color: string): CanvasGradient {
  const gradient = ctx.createLinearGradient(0, 0, 0, 150);
  gradient.addColorStop(0, hexToRgba(color, 0.35));
  gradient.addColorStop(1, color);
  return gradient;
}
And finally the properties for a TrendChart can be memoized, or otherwise constructed as the labels and datasets described above.
jsx
{
  labels,
  // List of labels for the X axis.
  datasets: [
    {
      pointStyle: 'circle',
      barThickness: 3,
      borderRadius: 4,
      data: values,
      // Data points for a line.
      borderColor: color,
      borderWidth: 2,
      fill: true,
      hoverBackgroundColor: color,
      backgroundColor: (context: ScriptableContext<'line'>) => {
        const { chart } = context;
        const { ctx } = chart;
        return createTrendGradient(ctx, color);
      },
    } as TrendDataset,
  ],
}
Constructing the values involves additional work beyond the scope of this article. This may involve cleaning and normalizing the data. Changing the datasets in response to a user-action such as hiding a group, or changing the granularity of datapoints, will use the built-in transition animations.